
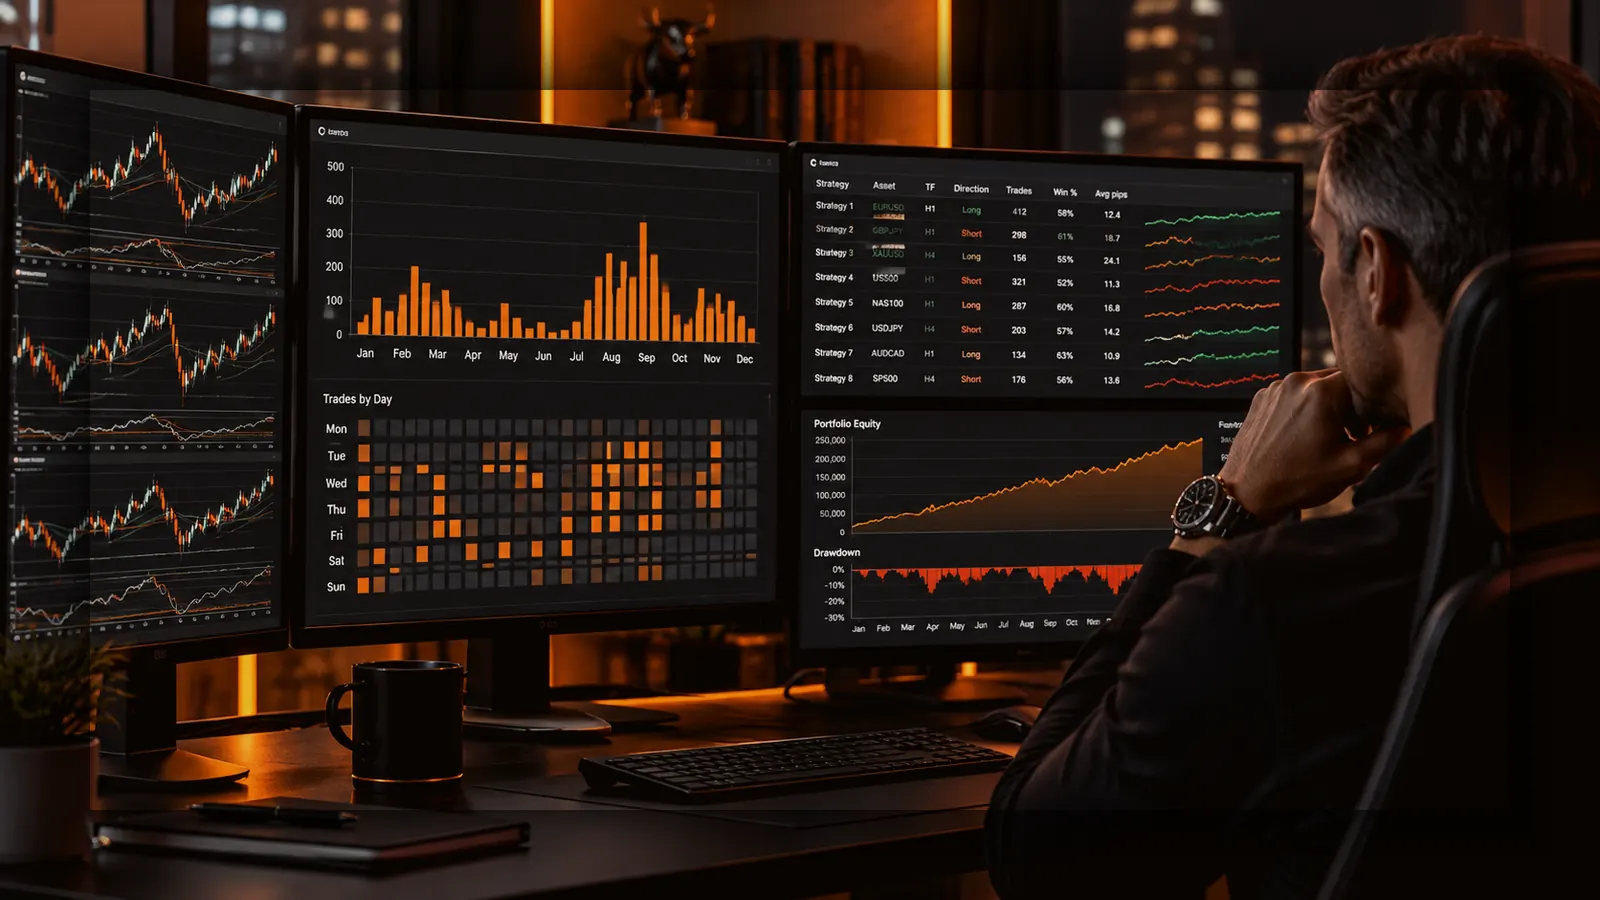
Trade frequency doesn’t get discussed as often as return or drawdown, but it quietly affects almost every other measure a trader relies on. Too few trades leaves every other statistic standing on thin evidence. Too much overlapping trading activity can concentrate risk in ways that aren’t obvious from the headline numbers. Neither extreme is automatically the safer or better one — frequency has to be evaluated in context, not judged by direction alone.
Frequency and statistical evidence
Every metric built from a strategy’s trade history — Profit Factor, Expectancy, Stability — is a statistical estimate, and every statistical estimate becomes more reliable with a larger sample. A strategy that only trades a handful of times a year can take years to accumulate a sample size that gives real confidence in its numbers. That doesn’t make a low-frequency strategy bad; it means its historical statistics should be read with more caution, and its live behaviour will take proportionally longer to confirm.
Very low-frequency strategies: patience required, evidence limited
A strategy that trades rarely can still be a genuinely valuable portfolio addition — particularly if it captures a distinct, infrequent opportunity that other, more active strategies don’t. The trade-off is that confirming its edge, either historically or live, simply takes longer, because there are fewer data points to confirm it with. This is worth factoring into expectations rather than treating a quiet strategy as underperforming.
Excessive overlapping activity: more trades isn’t automatically safer
At the other end, a strategy — or a portfolio of strategies — that trades very frequently isn’t automatically diversified just because there’s a lot of activity. If many trades are opening and closing in overlapping windows, driven by similar underlying logic, that activity can represent concentrated exposure happening quickly and repeatedly, rather than genuinely varied opportunity. High frequency can create a comforting illusion of breadth while actually representing the same bet, taken many times in a short period.
Trade opportunity distribution across a portfolio
At the portfolio level, it’s worth looking not just at total trade count but at how that activity is distributed across the portfolio’s member strategies and across time. A portfolio where nearly all activity comes from one or two high-frequency strategies is, in practice, more concentrated than its member count suggests — the quieter strategies are barely contributing evidence to the combined result, whatever their individual quality.
Neither direction is automatically better
It’s worth stating plainly: higher trade frequency is not automatically an improvement, and lower trade frequency is not automatically a safety feature. A strategy that suddenly trades far more often than its history suggests deserves scrutiny, not automatic credit for being “more active.” Equally, a quiet strategy isn’t inherently safer just because it trades less — it’s simply providing less evidence, in either direction, over any given period.
This is directly consistent with how live trading frequency is treated once a strategy is connected and monitored: an increase in live trade frequency compared to a strategy’s historical pattern is not automatically interpreted as an improvement. It’s a change worth understanding, the same way a decrease would be — see How to Tell When a Live EA Is Behaving Differently From Its History for how that kind of comparison is approached.
Reading frequency alongside other metrics
Trade frequency is best read next to the strategy’s other metrics rather than as a standalone judgement — see Profit Factor, Expectancy, Stability and Trade Count. A strong Profit Factor built on very few trades and a strong Profit Factor built on many trades are different kinds of evidence, even when the ratio itself looks identical.
Where this fits in the SIPS workflow
Trade count and frequency are part of the sample evidence shown throughout Strategy Metrics Explained and a strategy’s own Strategy Performance page. Once a portfolio is connected live, Historical vs Live Behaviour covers how live Trade Frequency is compared against a strategy’s historical pattern, without assuming that more activity automatically means improvement.
The practical takeaway
Trade frequency shapes how much you can trust every other number a strategy produces. Judge it by whether it gives you enough evidence to trust the result, and whether that activity represents genuinely varied opportunity — not by whether the number is simply higher or lower than expected.